5-Card Friday
A Bi-Weekly Update from the ITS UX Team
New Location of Users Data Studio Report
Have you ever wondered where your users are located?
Check out the new "Location of Users" Data Studio report to see the countries and cities of your site's visitors!
Flip the card over to learn more.
Location of Users GA Report
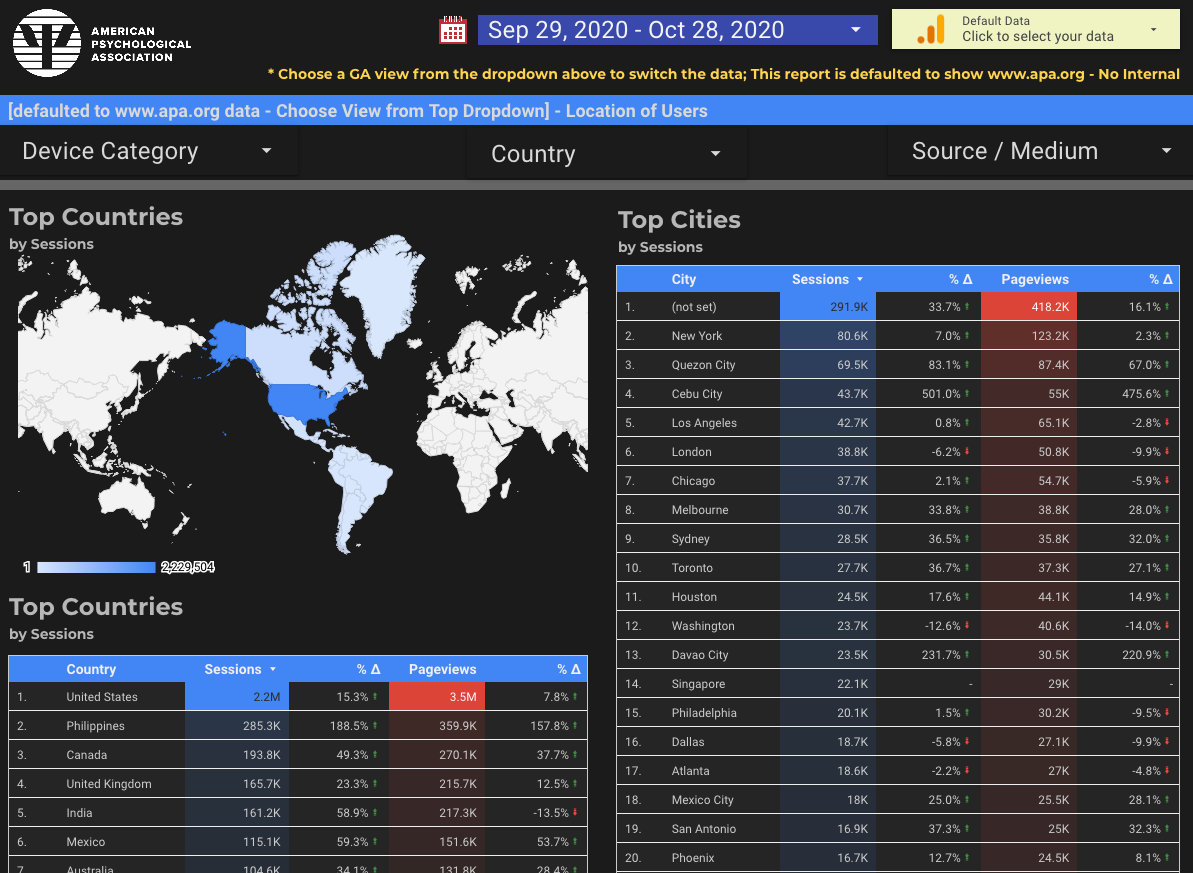
A new report has been added to the "Monthly GA/GSC Report" Data Studio dashboard to show where users are located.
Note that Google Analytics determines the users' location based on where their IP is–where their internet connection is, not where they actually are.
- Google Analytics is the data source for the Location of Users Data Studio report, and the default GA view is the "~0001 www.apa.org - No Internal" view. You can search for and select a different data source by clicking on the top-right dropdown.
- The report is defaulted to show data from the last 30 days, and you can change that with the datepicker at the top.
- The trend columns for both sessions and pageviews are comparing the date period of data you are looking at to the previous period of data (e.g., the last 30 days compared to the previous 30 days before that).
- As with all Data Studio reports, you can click on the column headings to sort the data, and you can paginate through the sets of data. There are also filters at the top of the report for choosing device category (desktop, mobile, and/or tablet), country, and source/medium.
You may be surprised about where the users to your site or app are located!
View the Report
Readability: the Optimal Line Length
Having the right amount of characters on each line is key to the readability of your text.
It shouldn’t merely be your design that dictates the width of your text, it should also be a matter of legibility.
Learn more on the back of this card.
Readability & UX
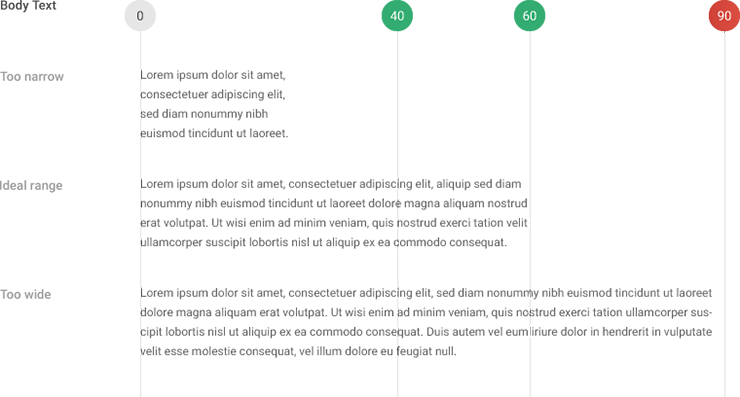
When designing responsive (mobile-friendly) user interfaces, one of things to consider is the length of the lines of text that the user is reading.
If the lines are too wide, the reader's eyes will have a hard time focusing on the text.
And, if the lines are too narrow, the reader's eyes will have to travel back too often, breaking their rhythm.
Find out what the suggested line length is from this article from the Baymard Institute.
Read Full Article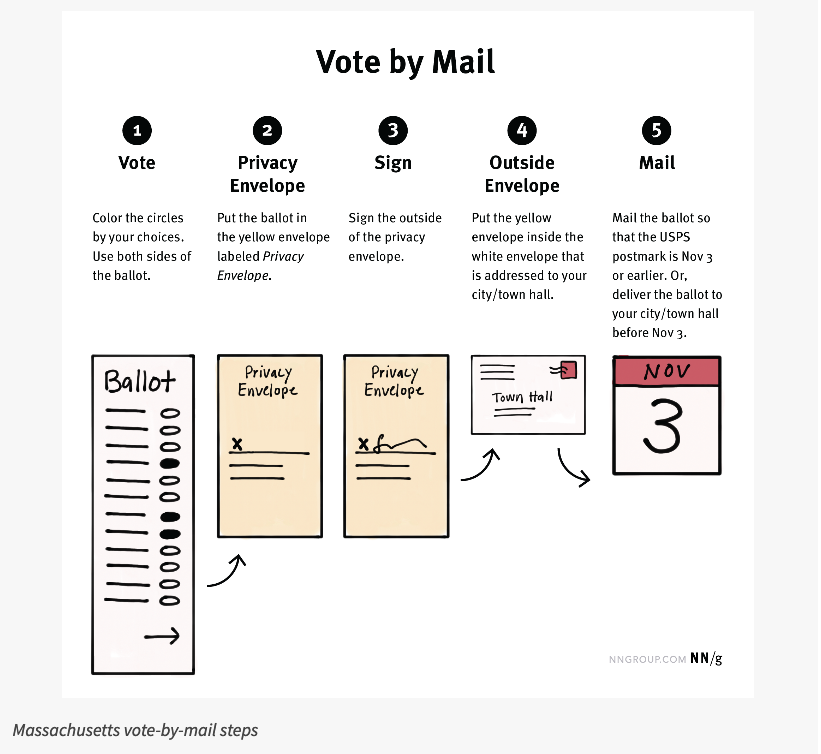
Vote By Mail: Mistakes Are Too Easy
The design of vote-by-mail materials (made imperative by the COVID-19 pandemic) have UX issues that make the voting process unnecessarily difficult and error prone.
Flip the card over to learn more.
Mail Ballot Usability
This NN/g article examines small usability issues that add up to drastic effects when looking at the vote-by-mail process.
Some of the problematic aspects discussed in the article include:
- The signature goes on the manila envelope, but some people would expect to sign the ballot.
- On the instructions page, there is a lot of text and no images. Especially in these cases, people often ignore or just skim the instructions.
- The due date appears in a box at the bottom of the page, but that could be easily disregarded because it looks like an ignorable footer.
The article doesn't just mention the bad aspects of UX and service design with the vote-by-mail process—it also goes over some of the good design qualities.
Read Full Article
Dos and Don'ts on Designing for Accessibility
The dos and don’ts of designing for accessibility are general guidelines, best design practices for making services accessible in government.
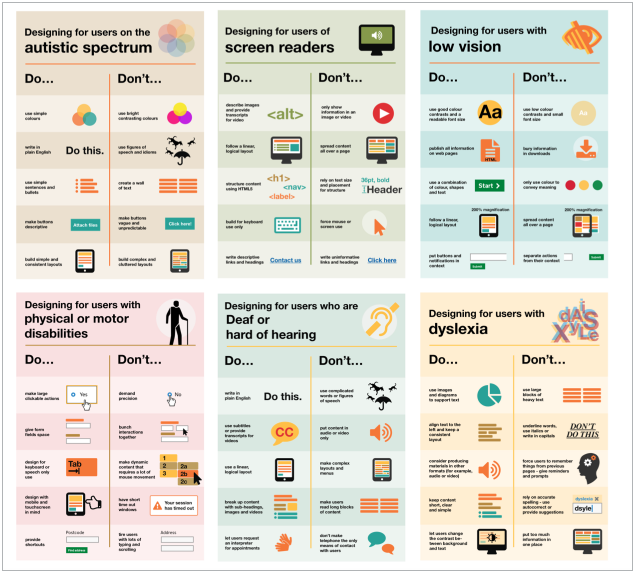
Currently, there are six different posters in the series that cater to users from these areas: low vision, D/deaf and hard of hearing, dyslexia, motor disabilities, users on the autistic spectrum and users of screen readers.
View the posters and learn more on the back of this card.
Dos and Don'ts on Designing for Accessibility
The aim of these posters is to raise awareness of various conditions through good design practice. Also, the posters are meant to be general guidance as opposed to being overly prescriptive.
Designing for users on the autistic spectrum
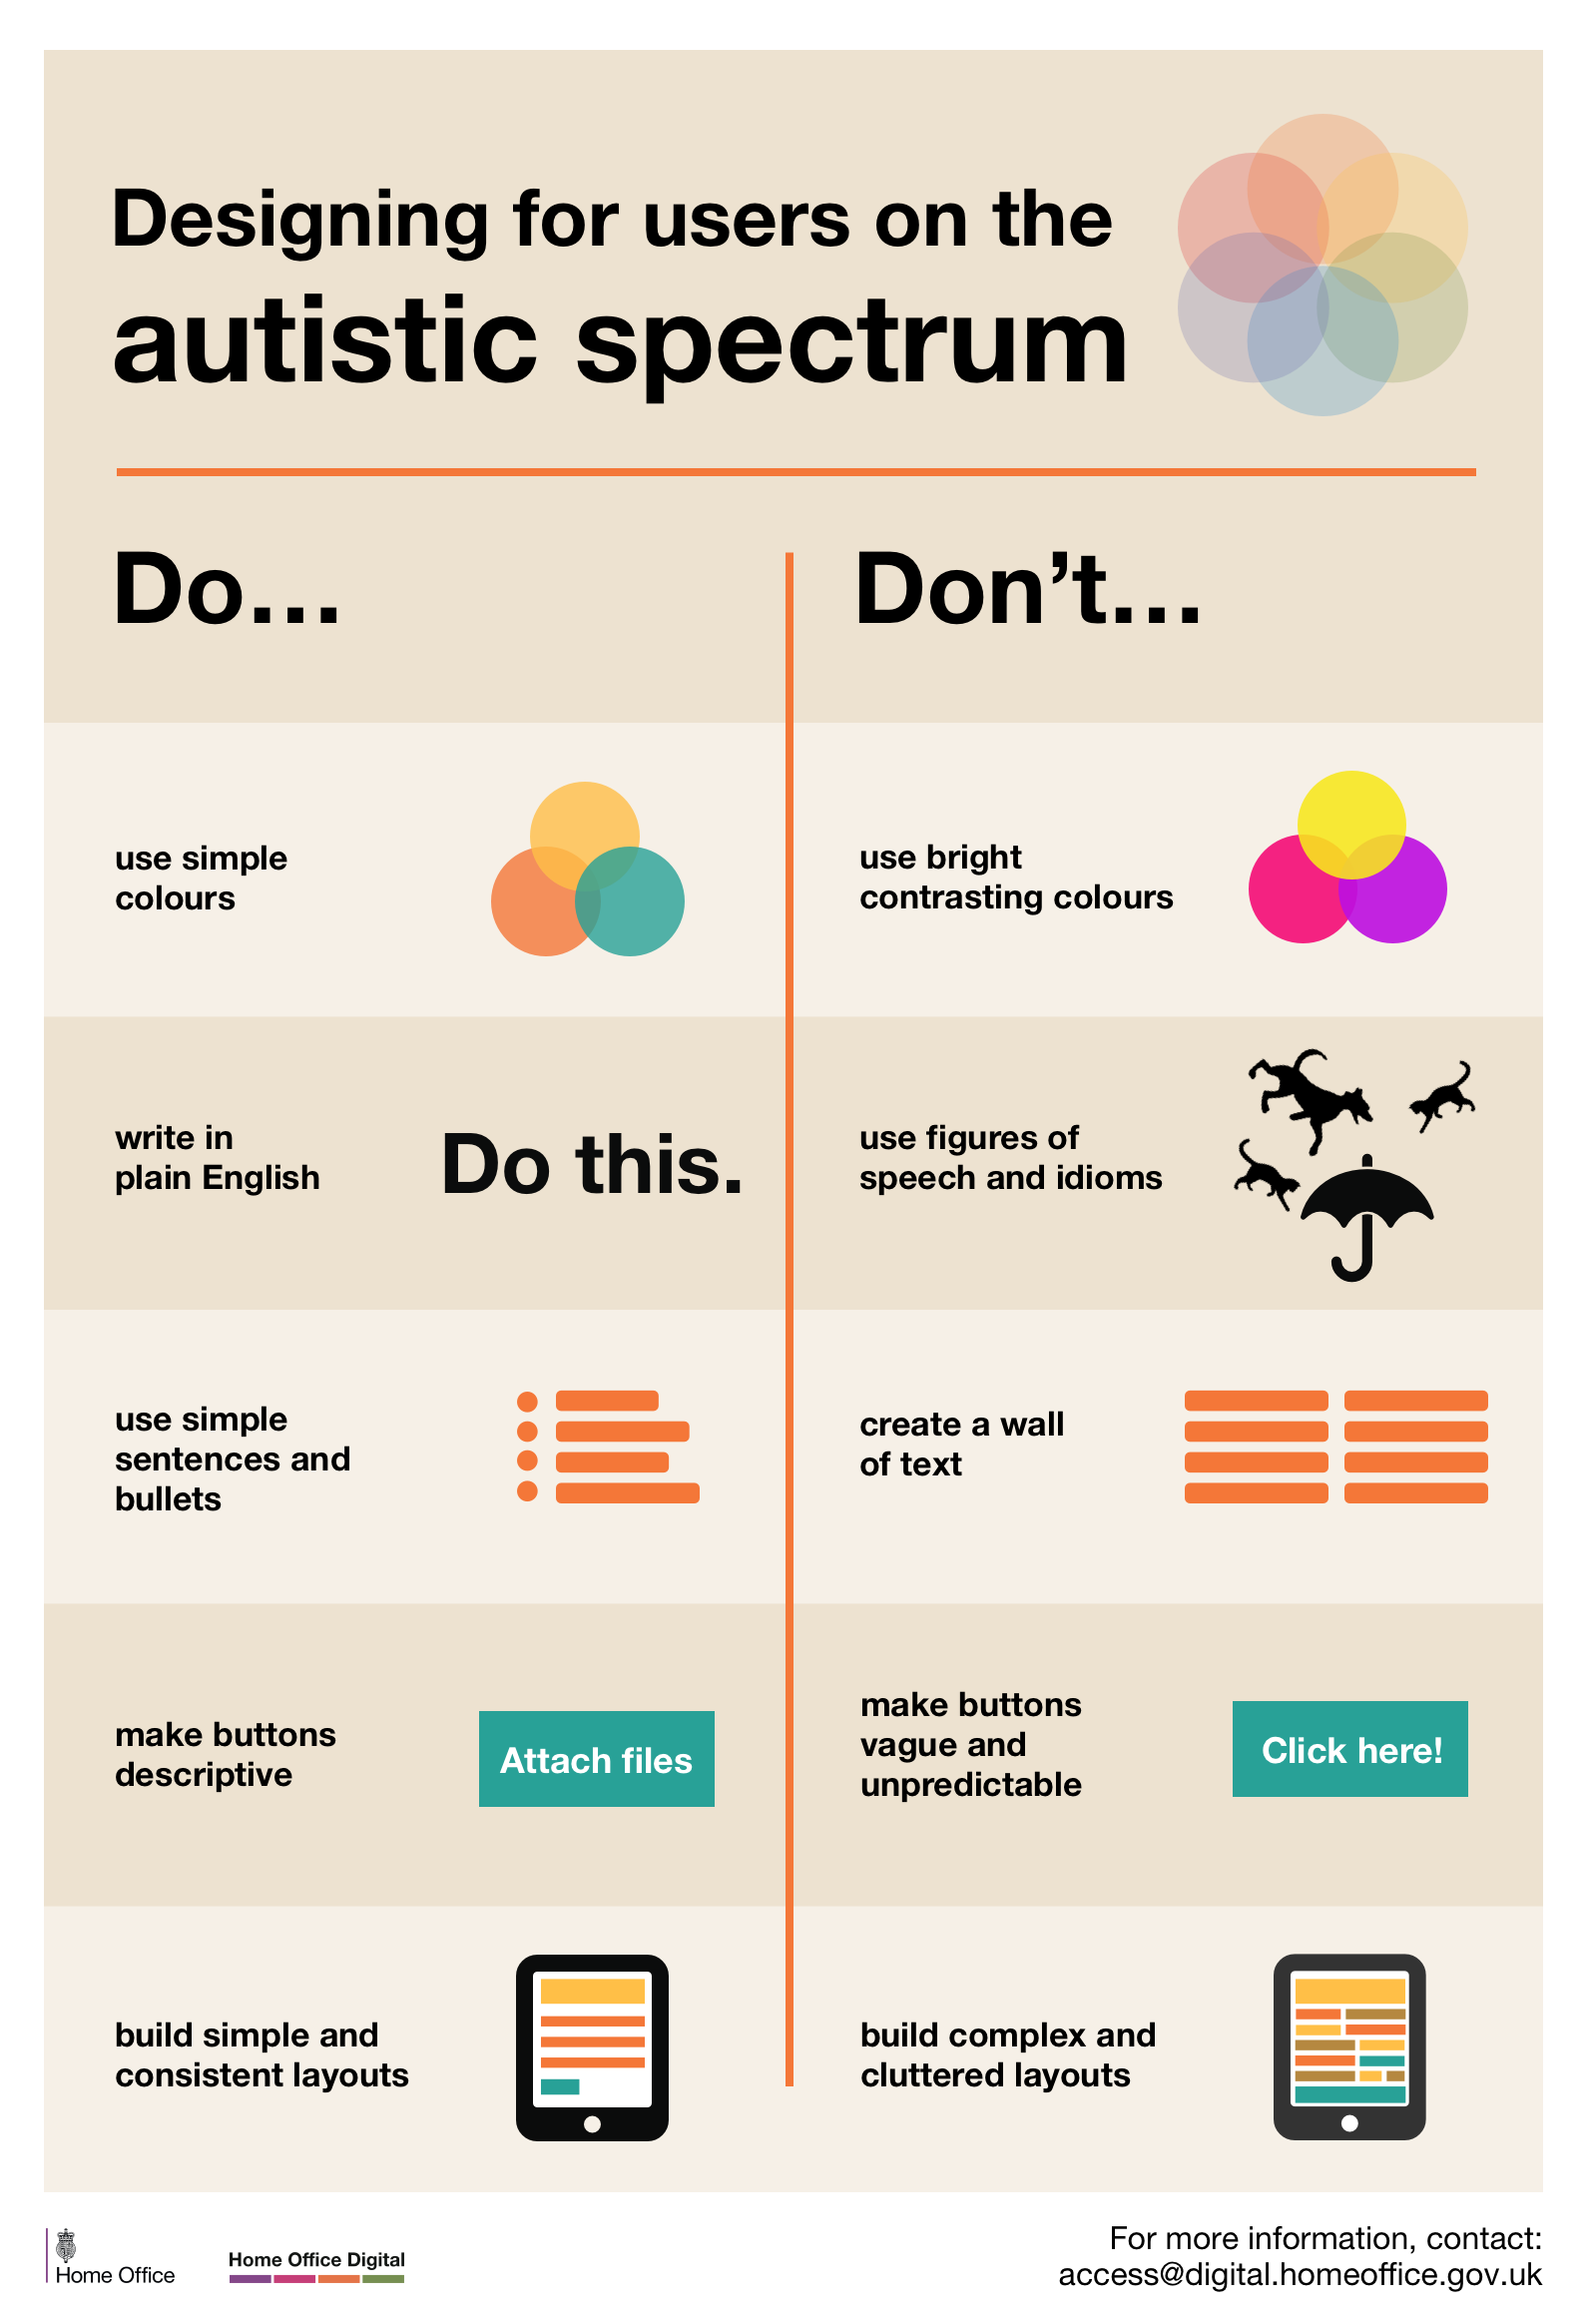
Designing for users of screen readers
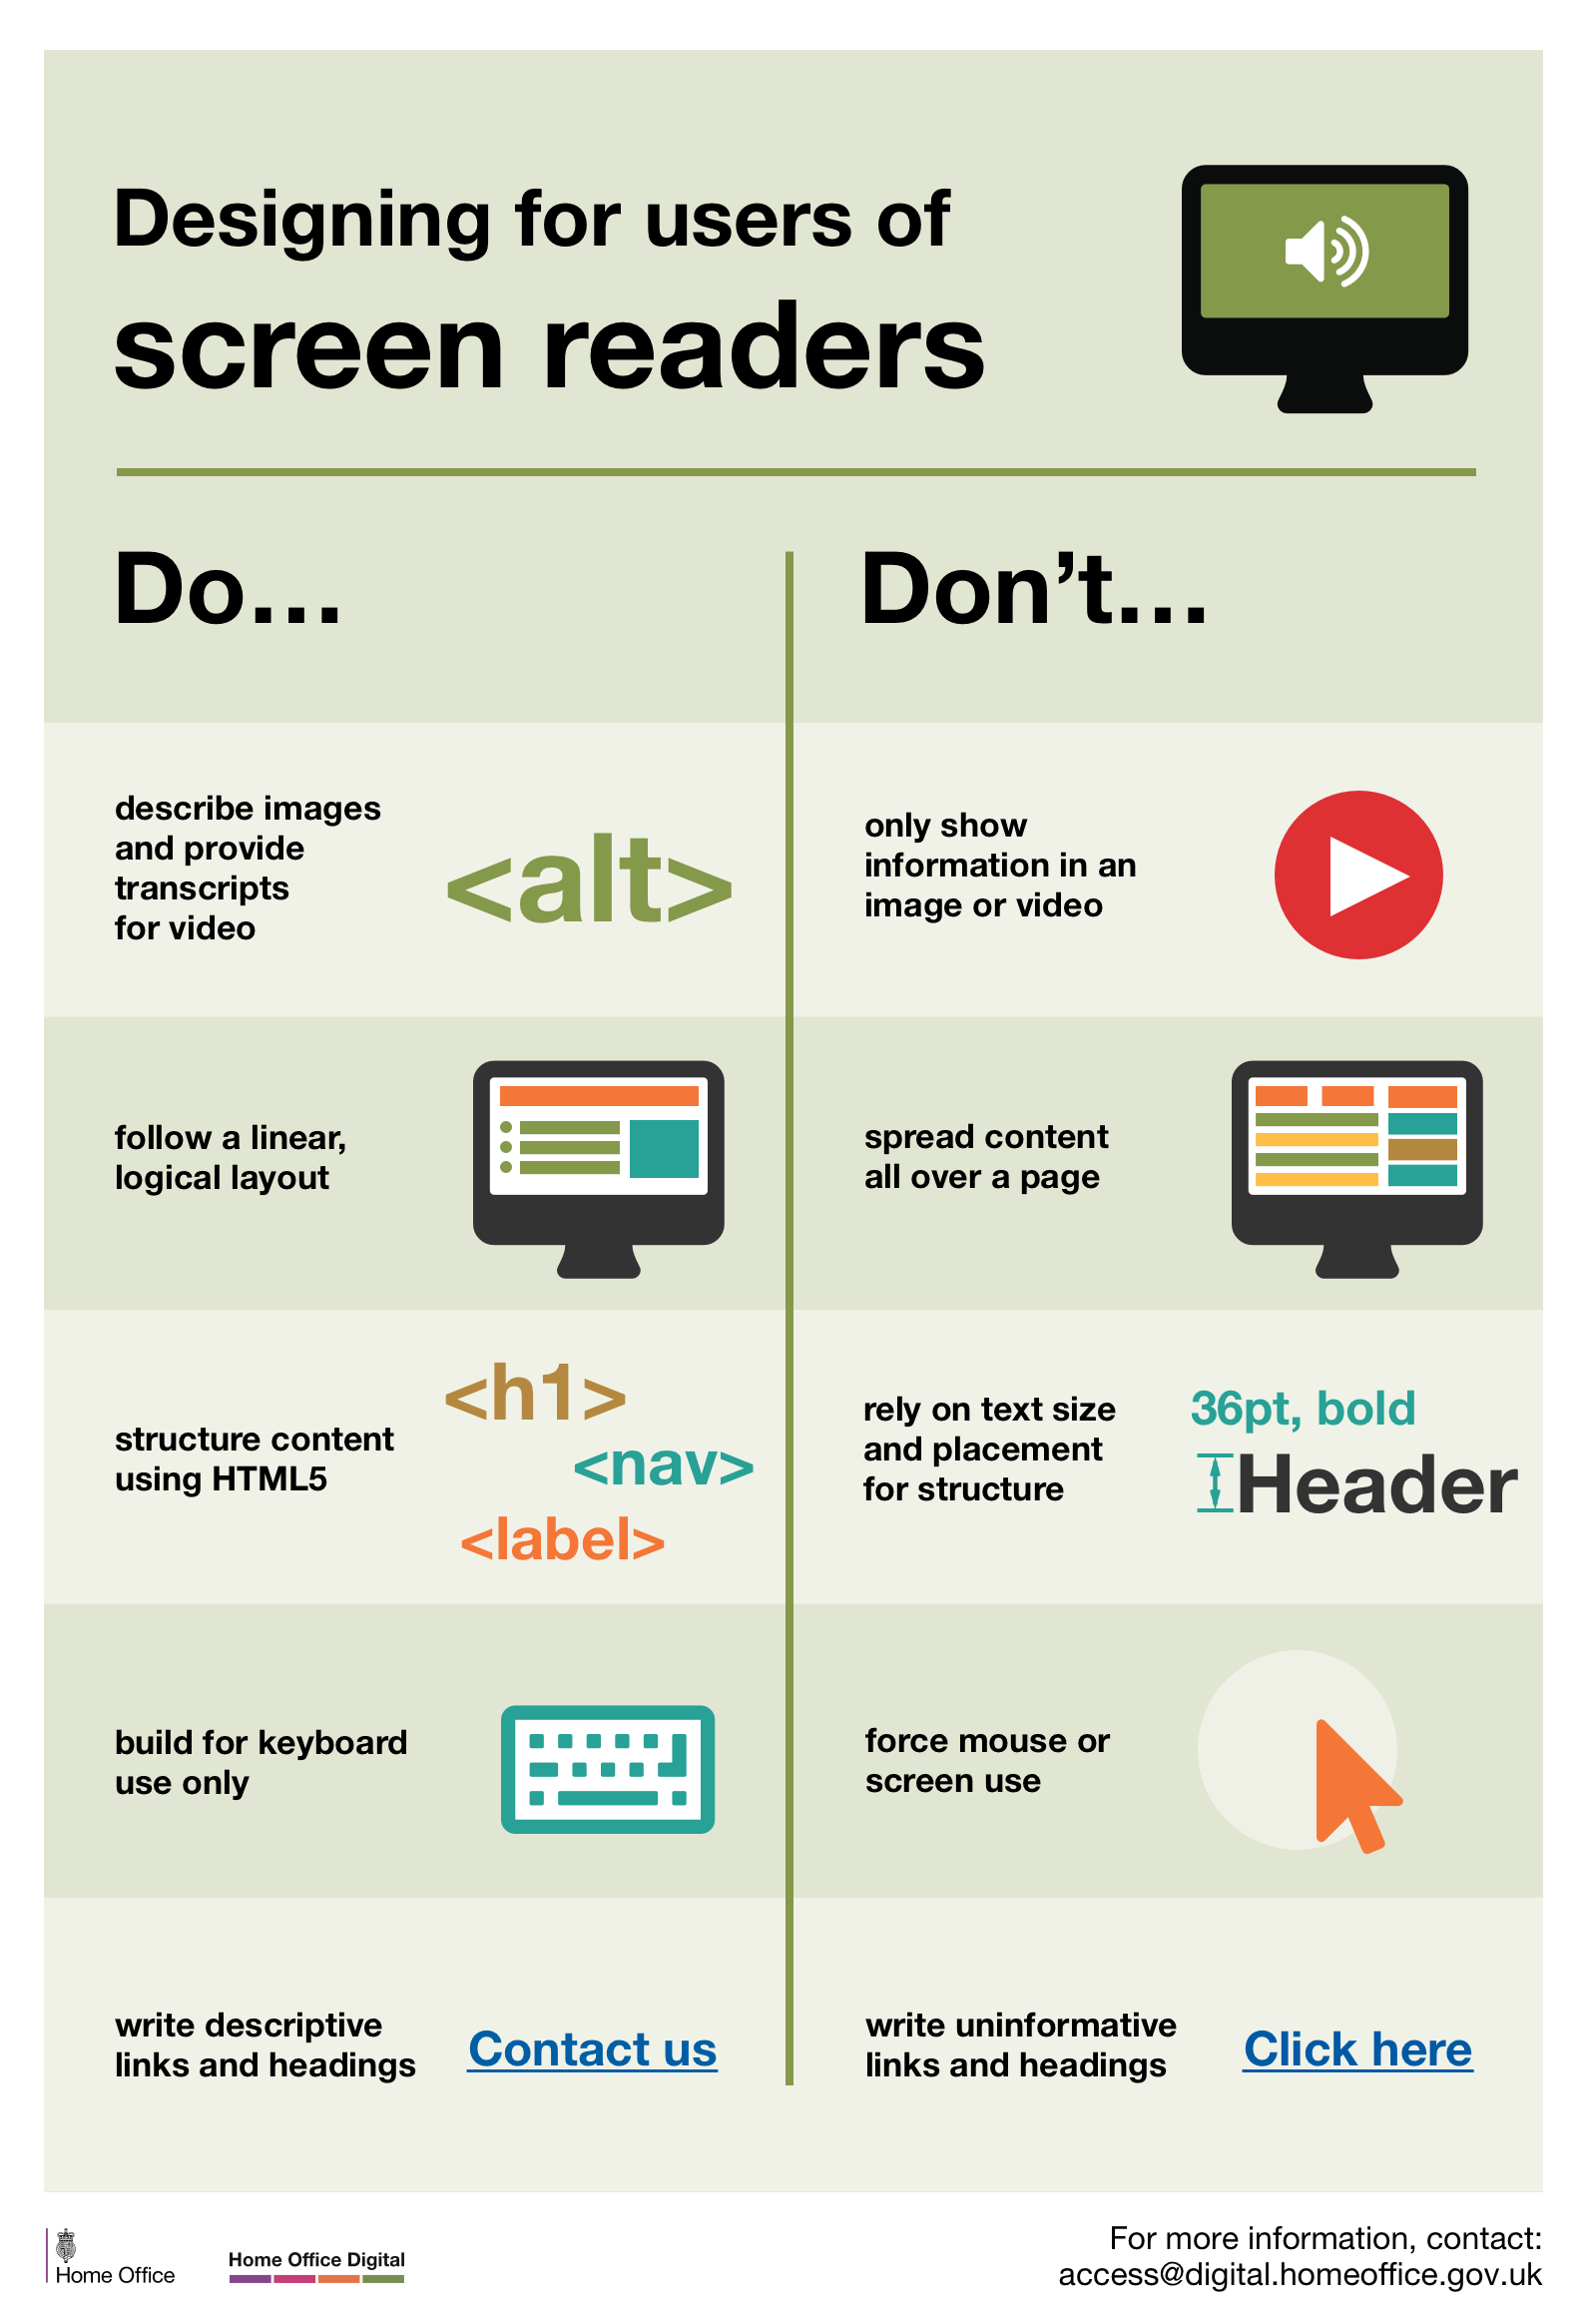
Designing for users with low vision
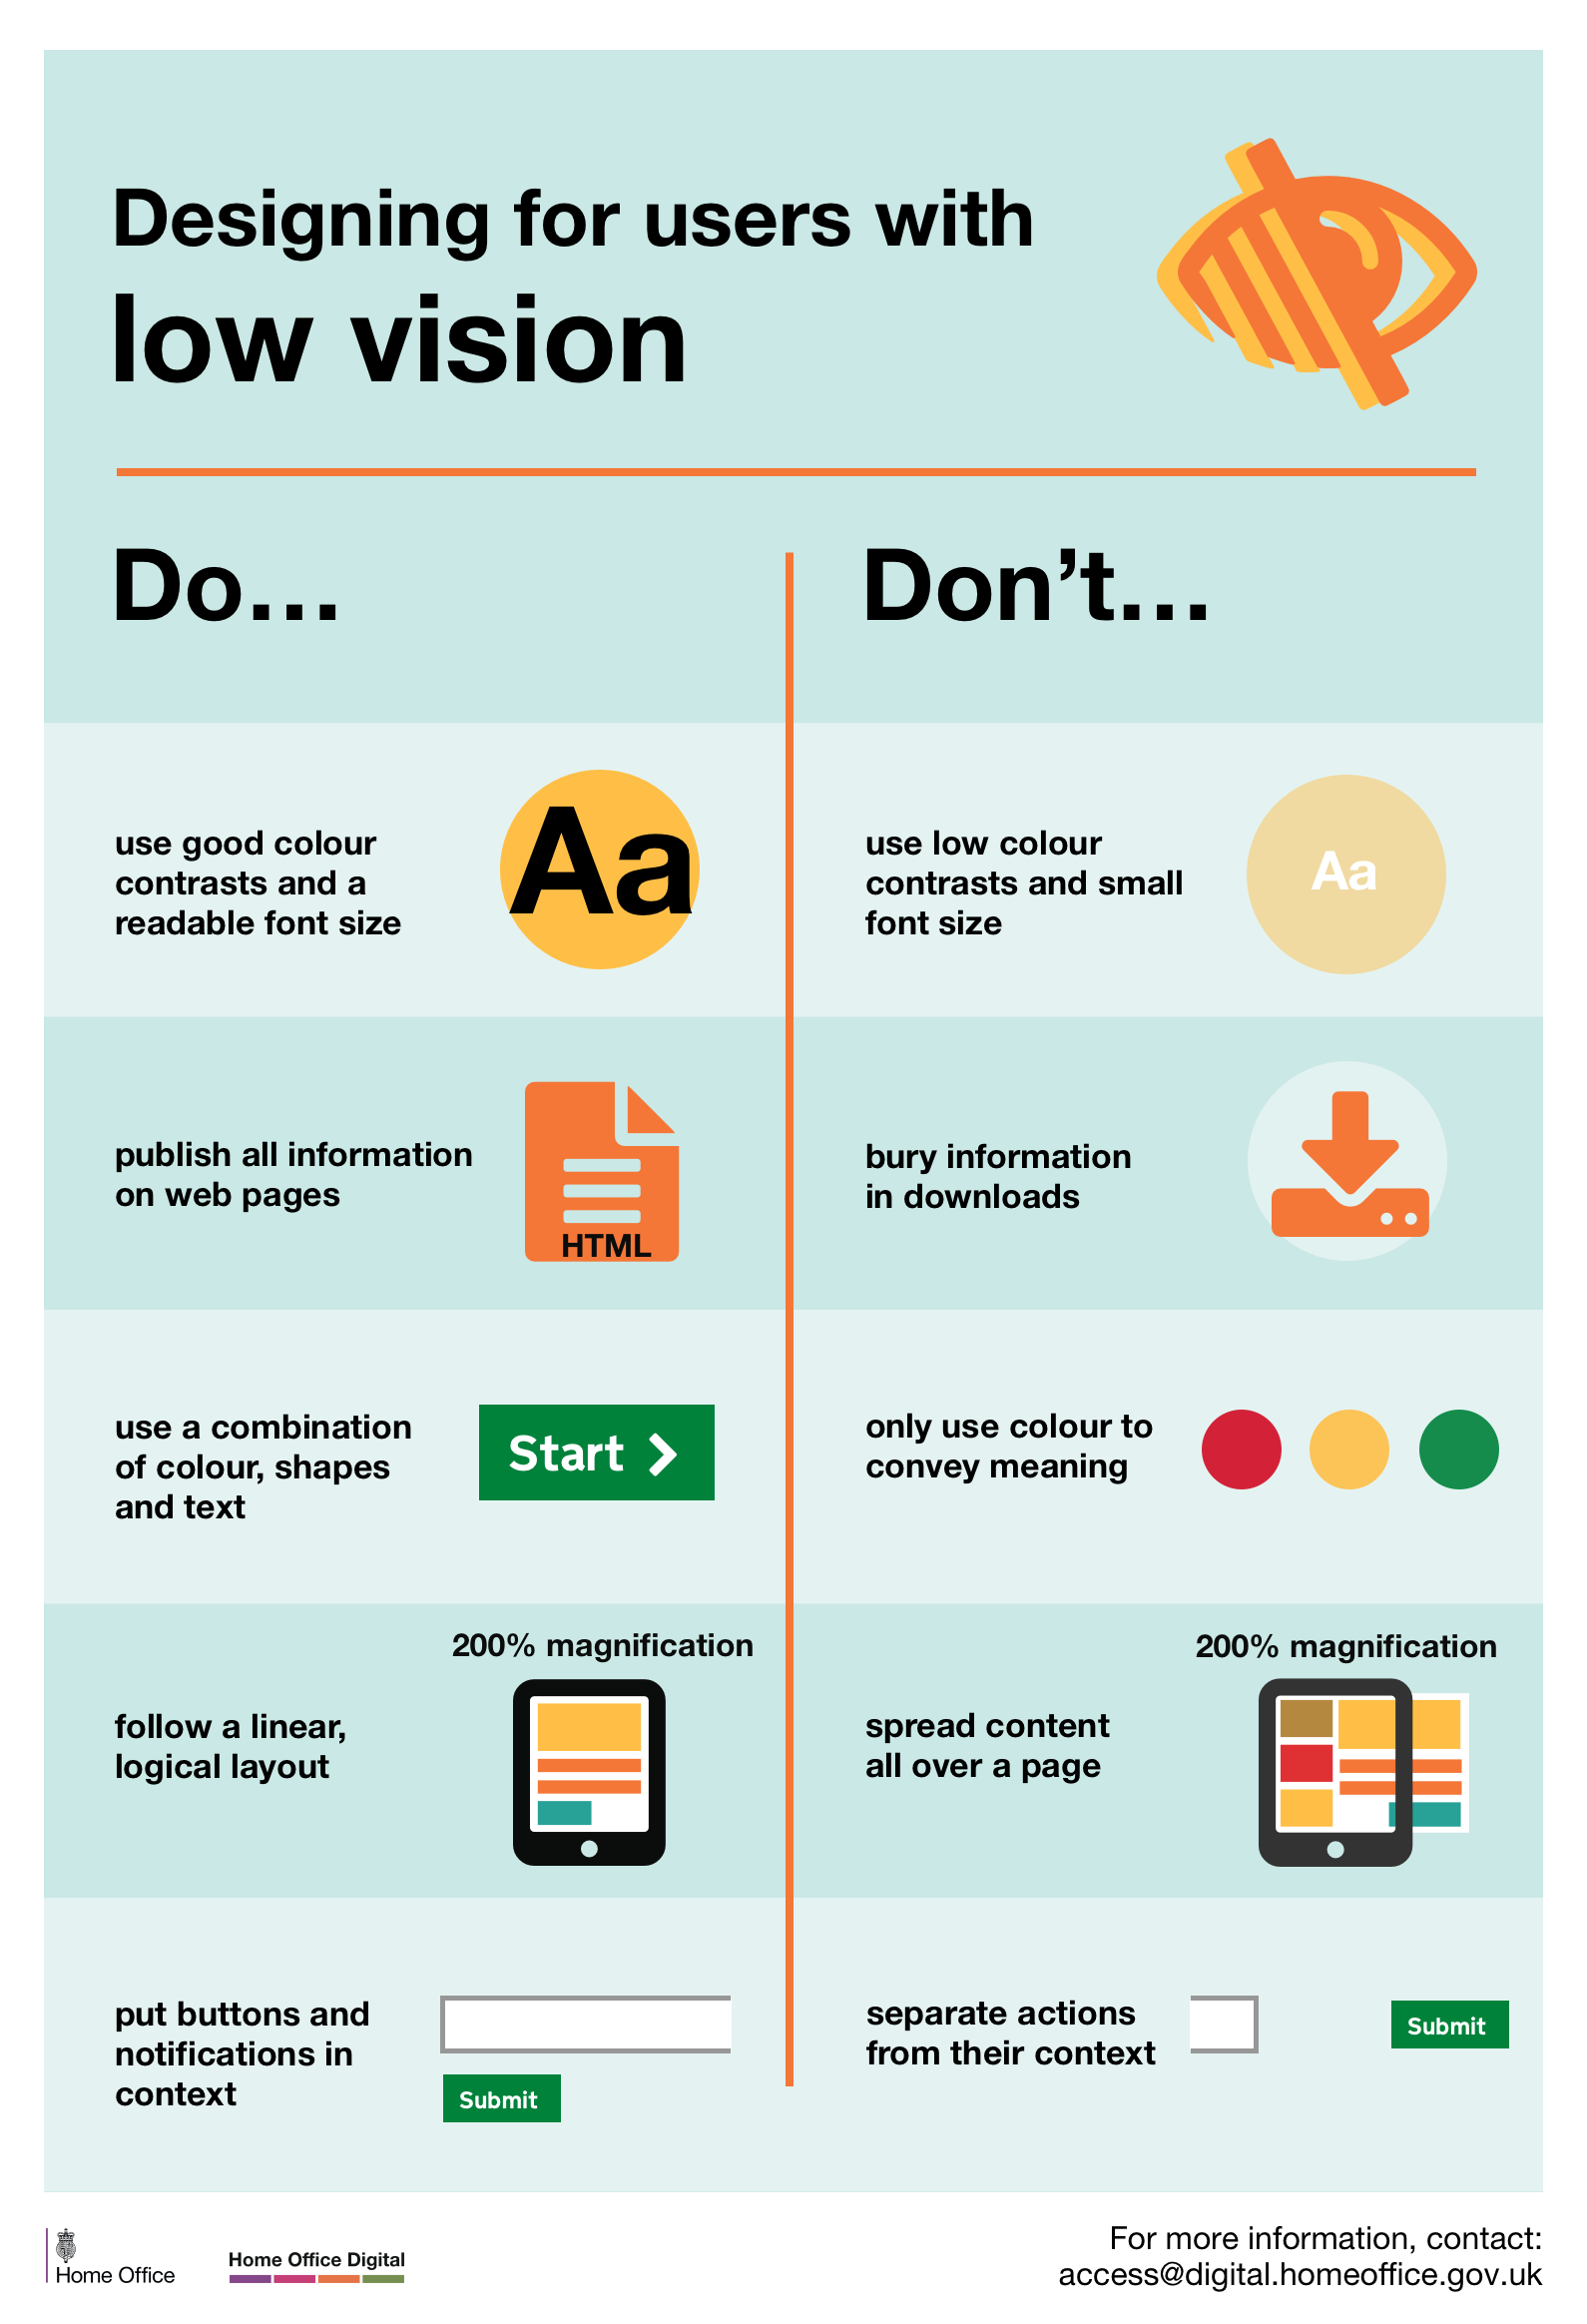
Designing for users with physical or motor disabilities
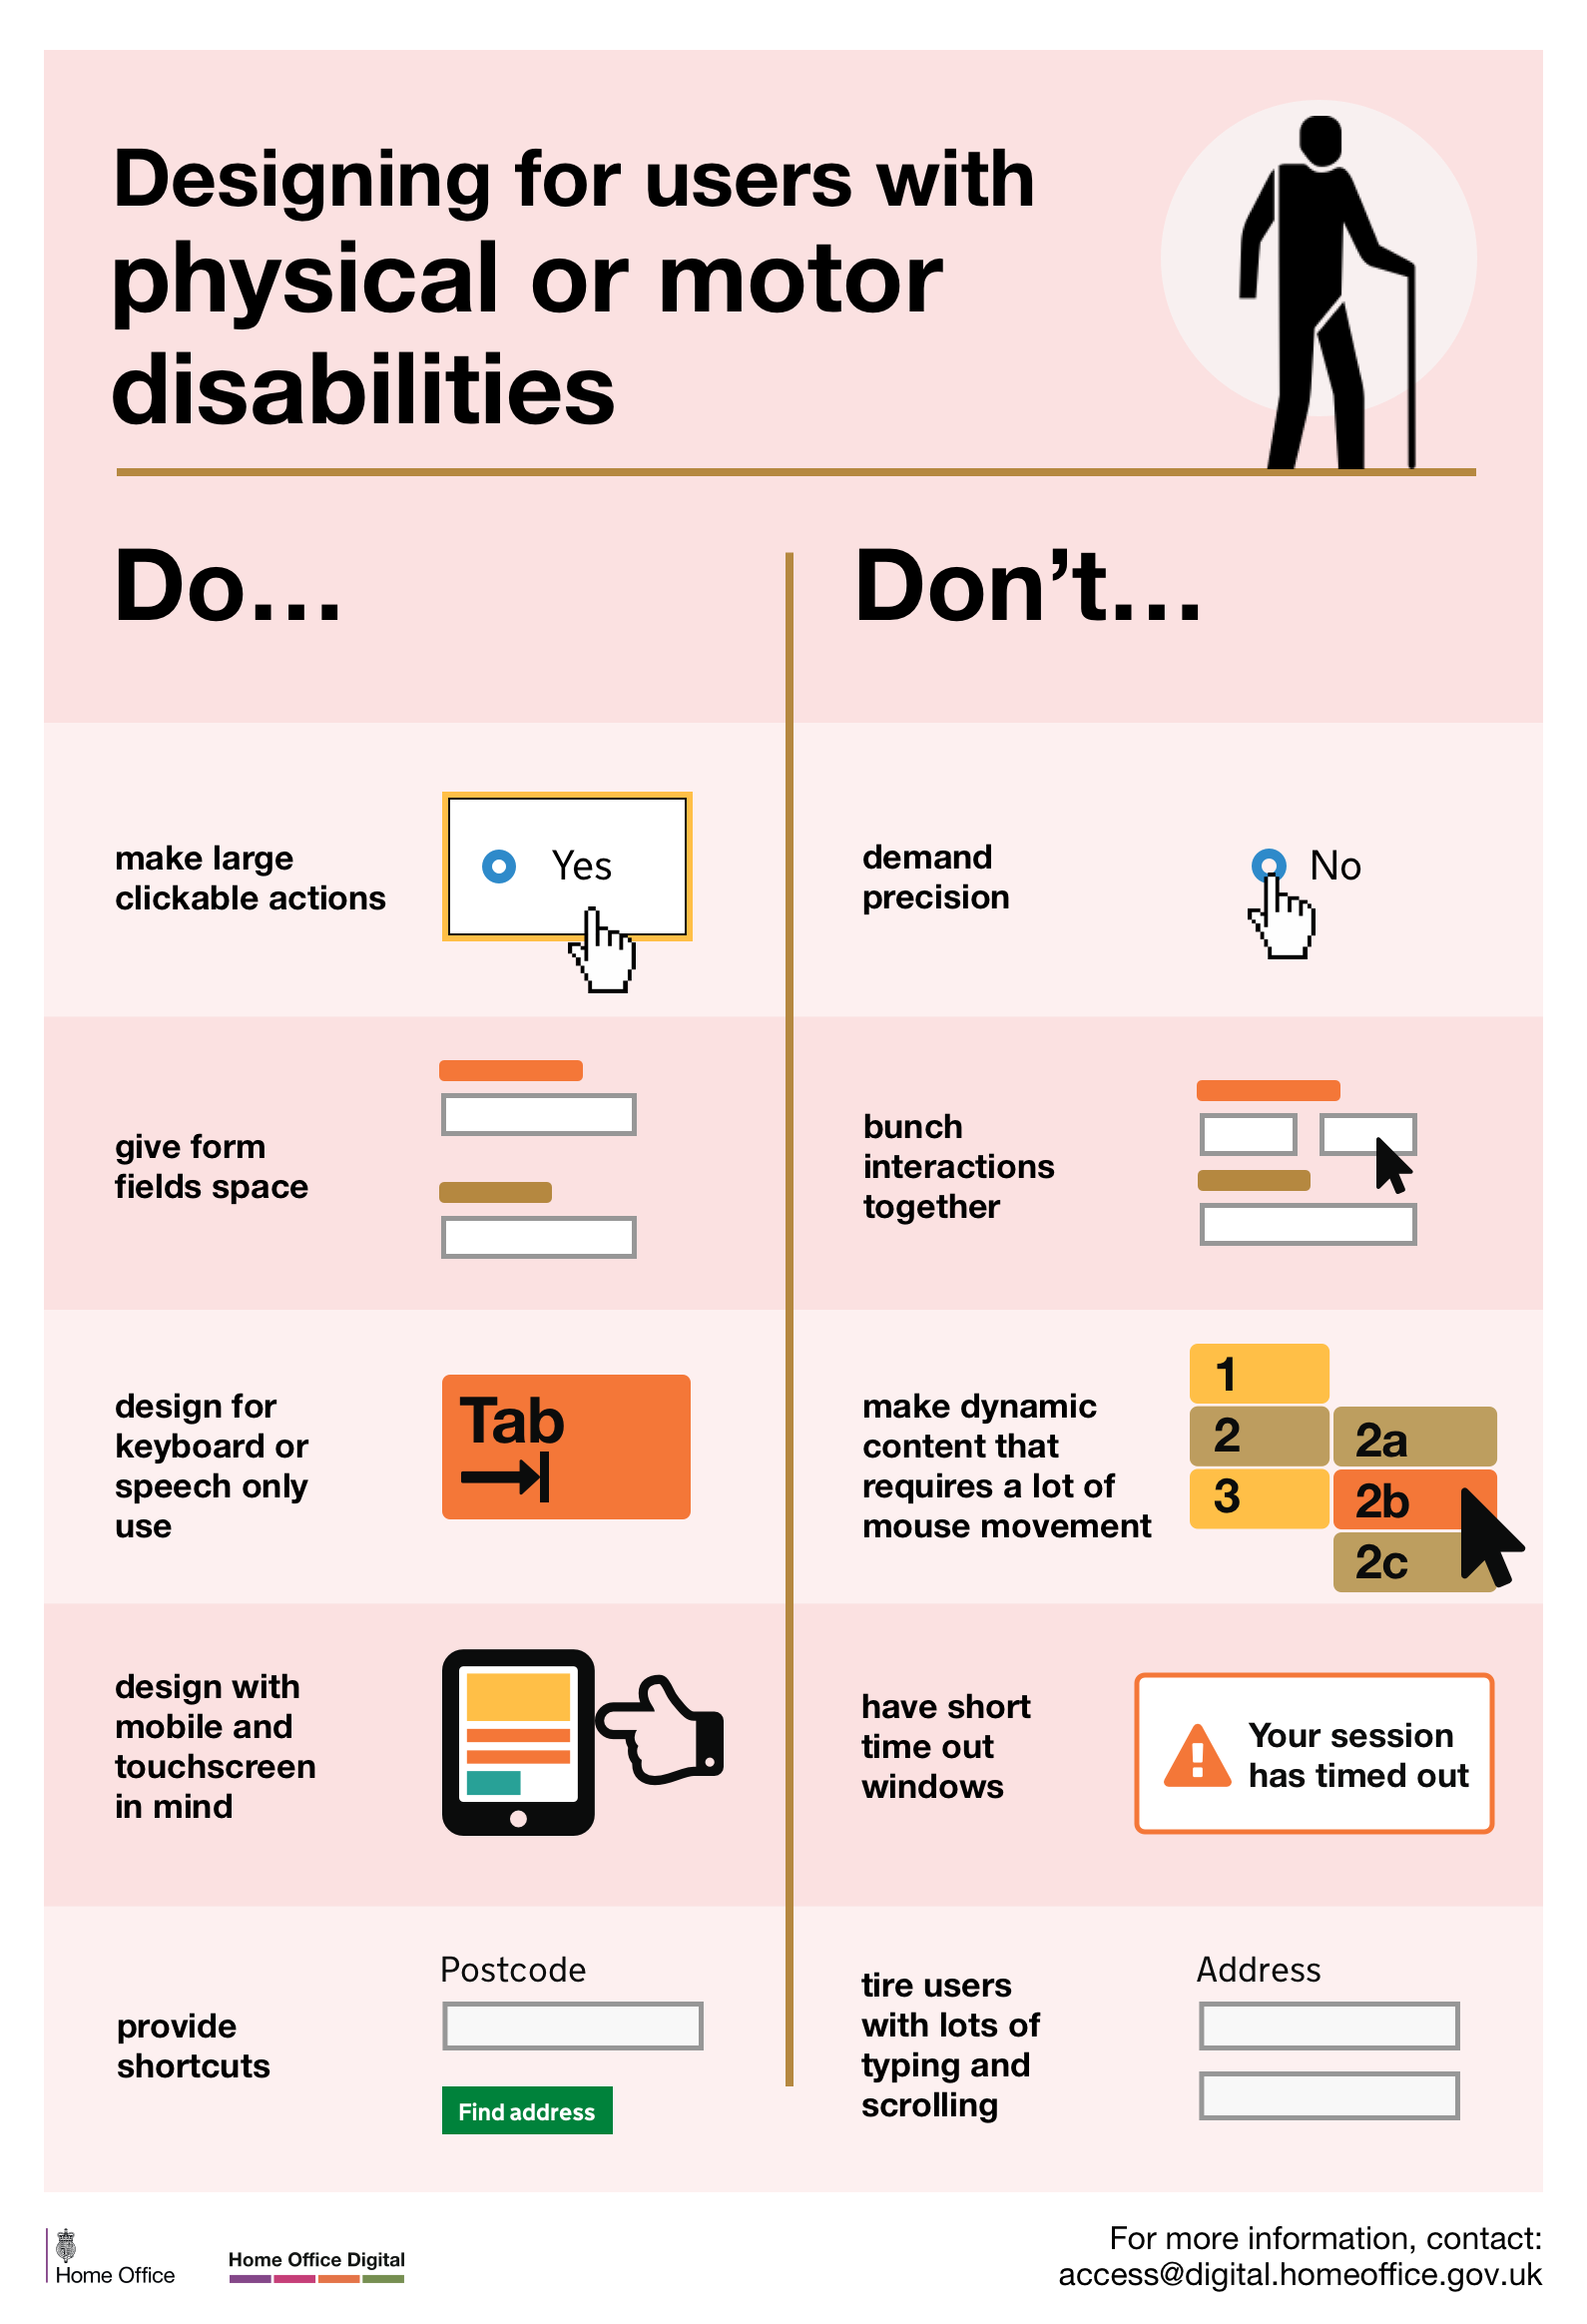
Designing for users who are D/deaf or hard of hearing
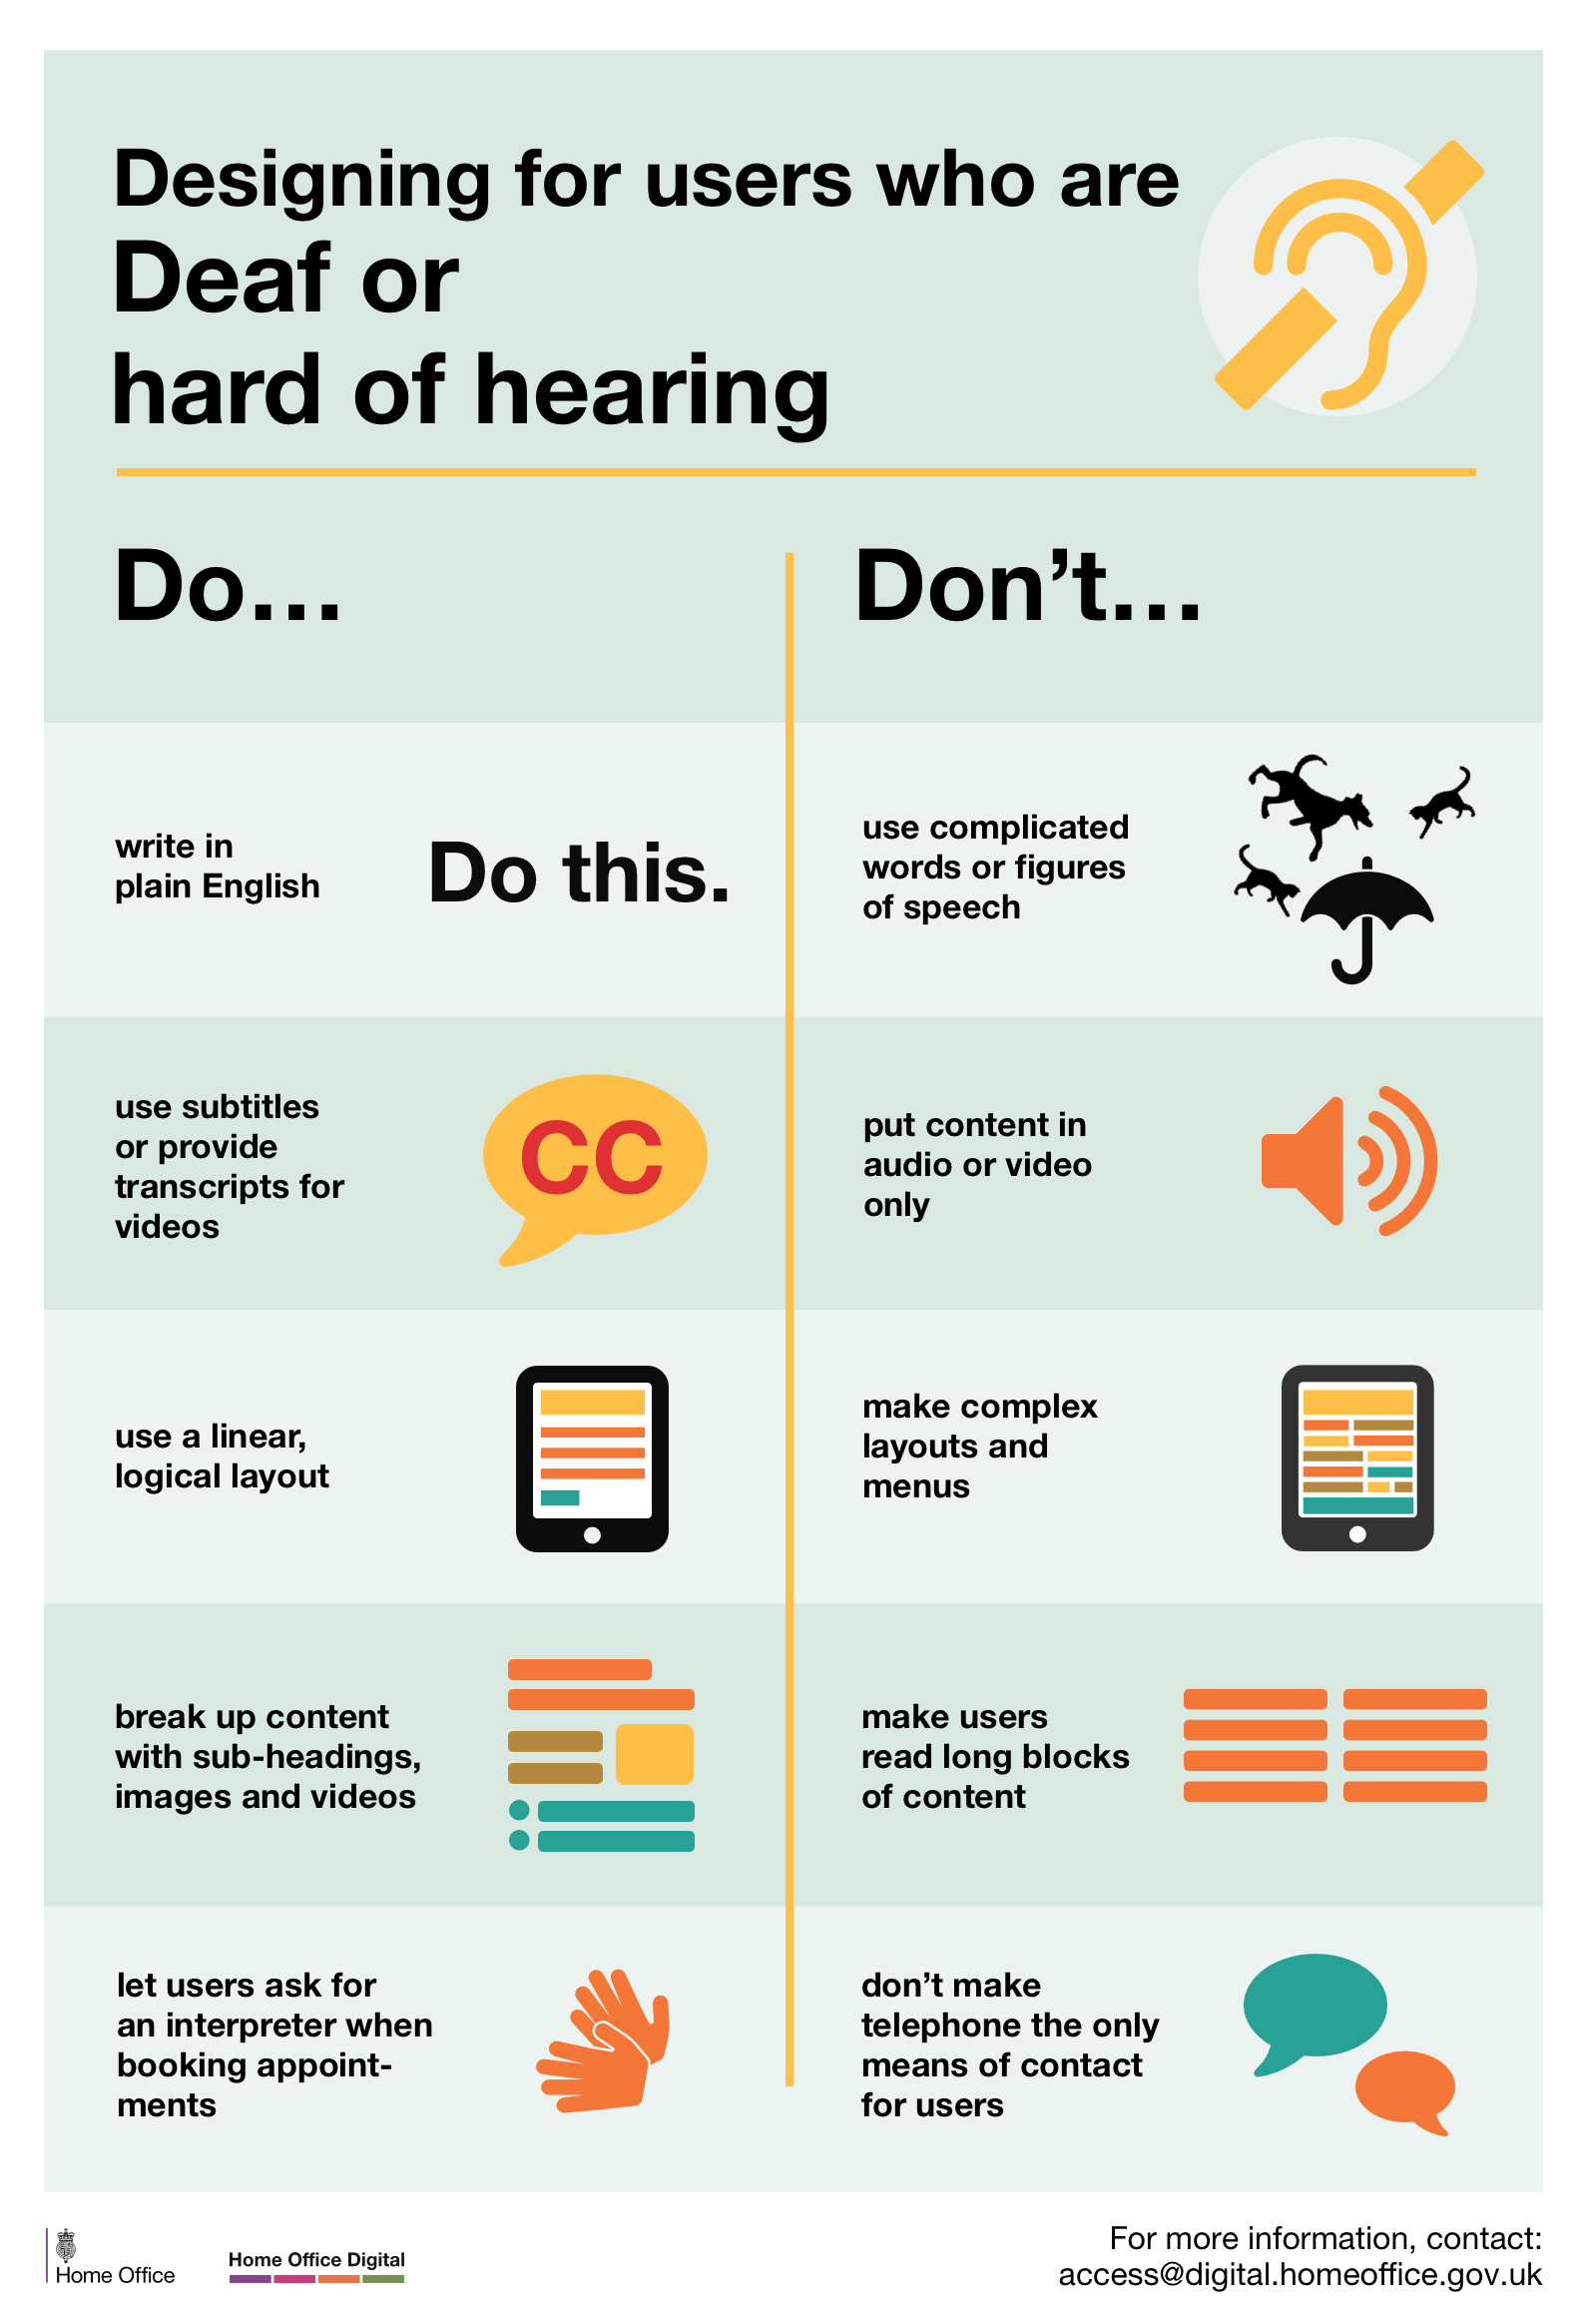
Designing for users with dyslexia
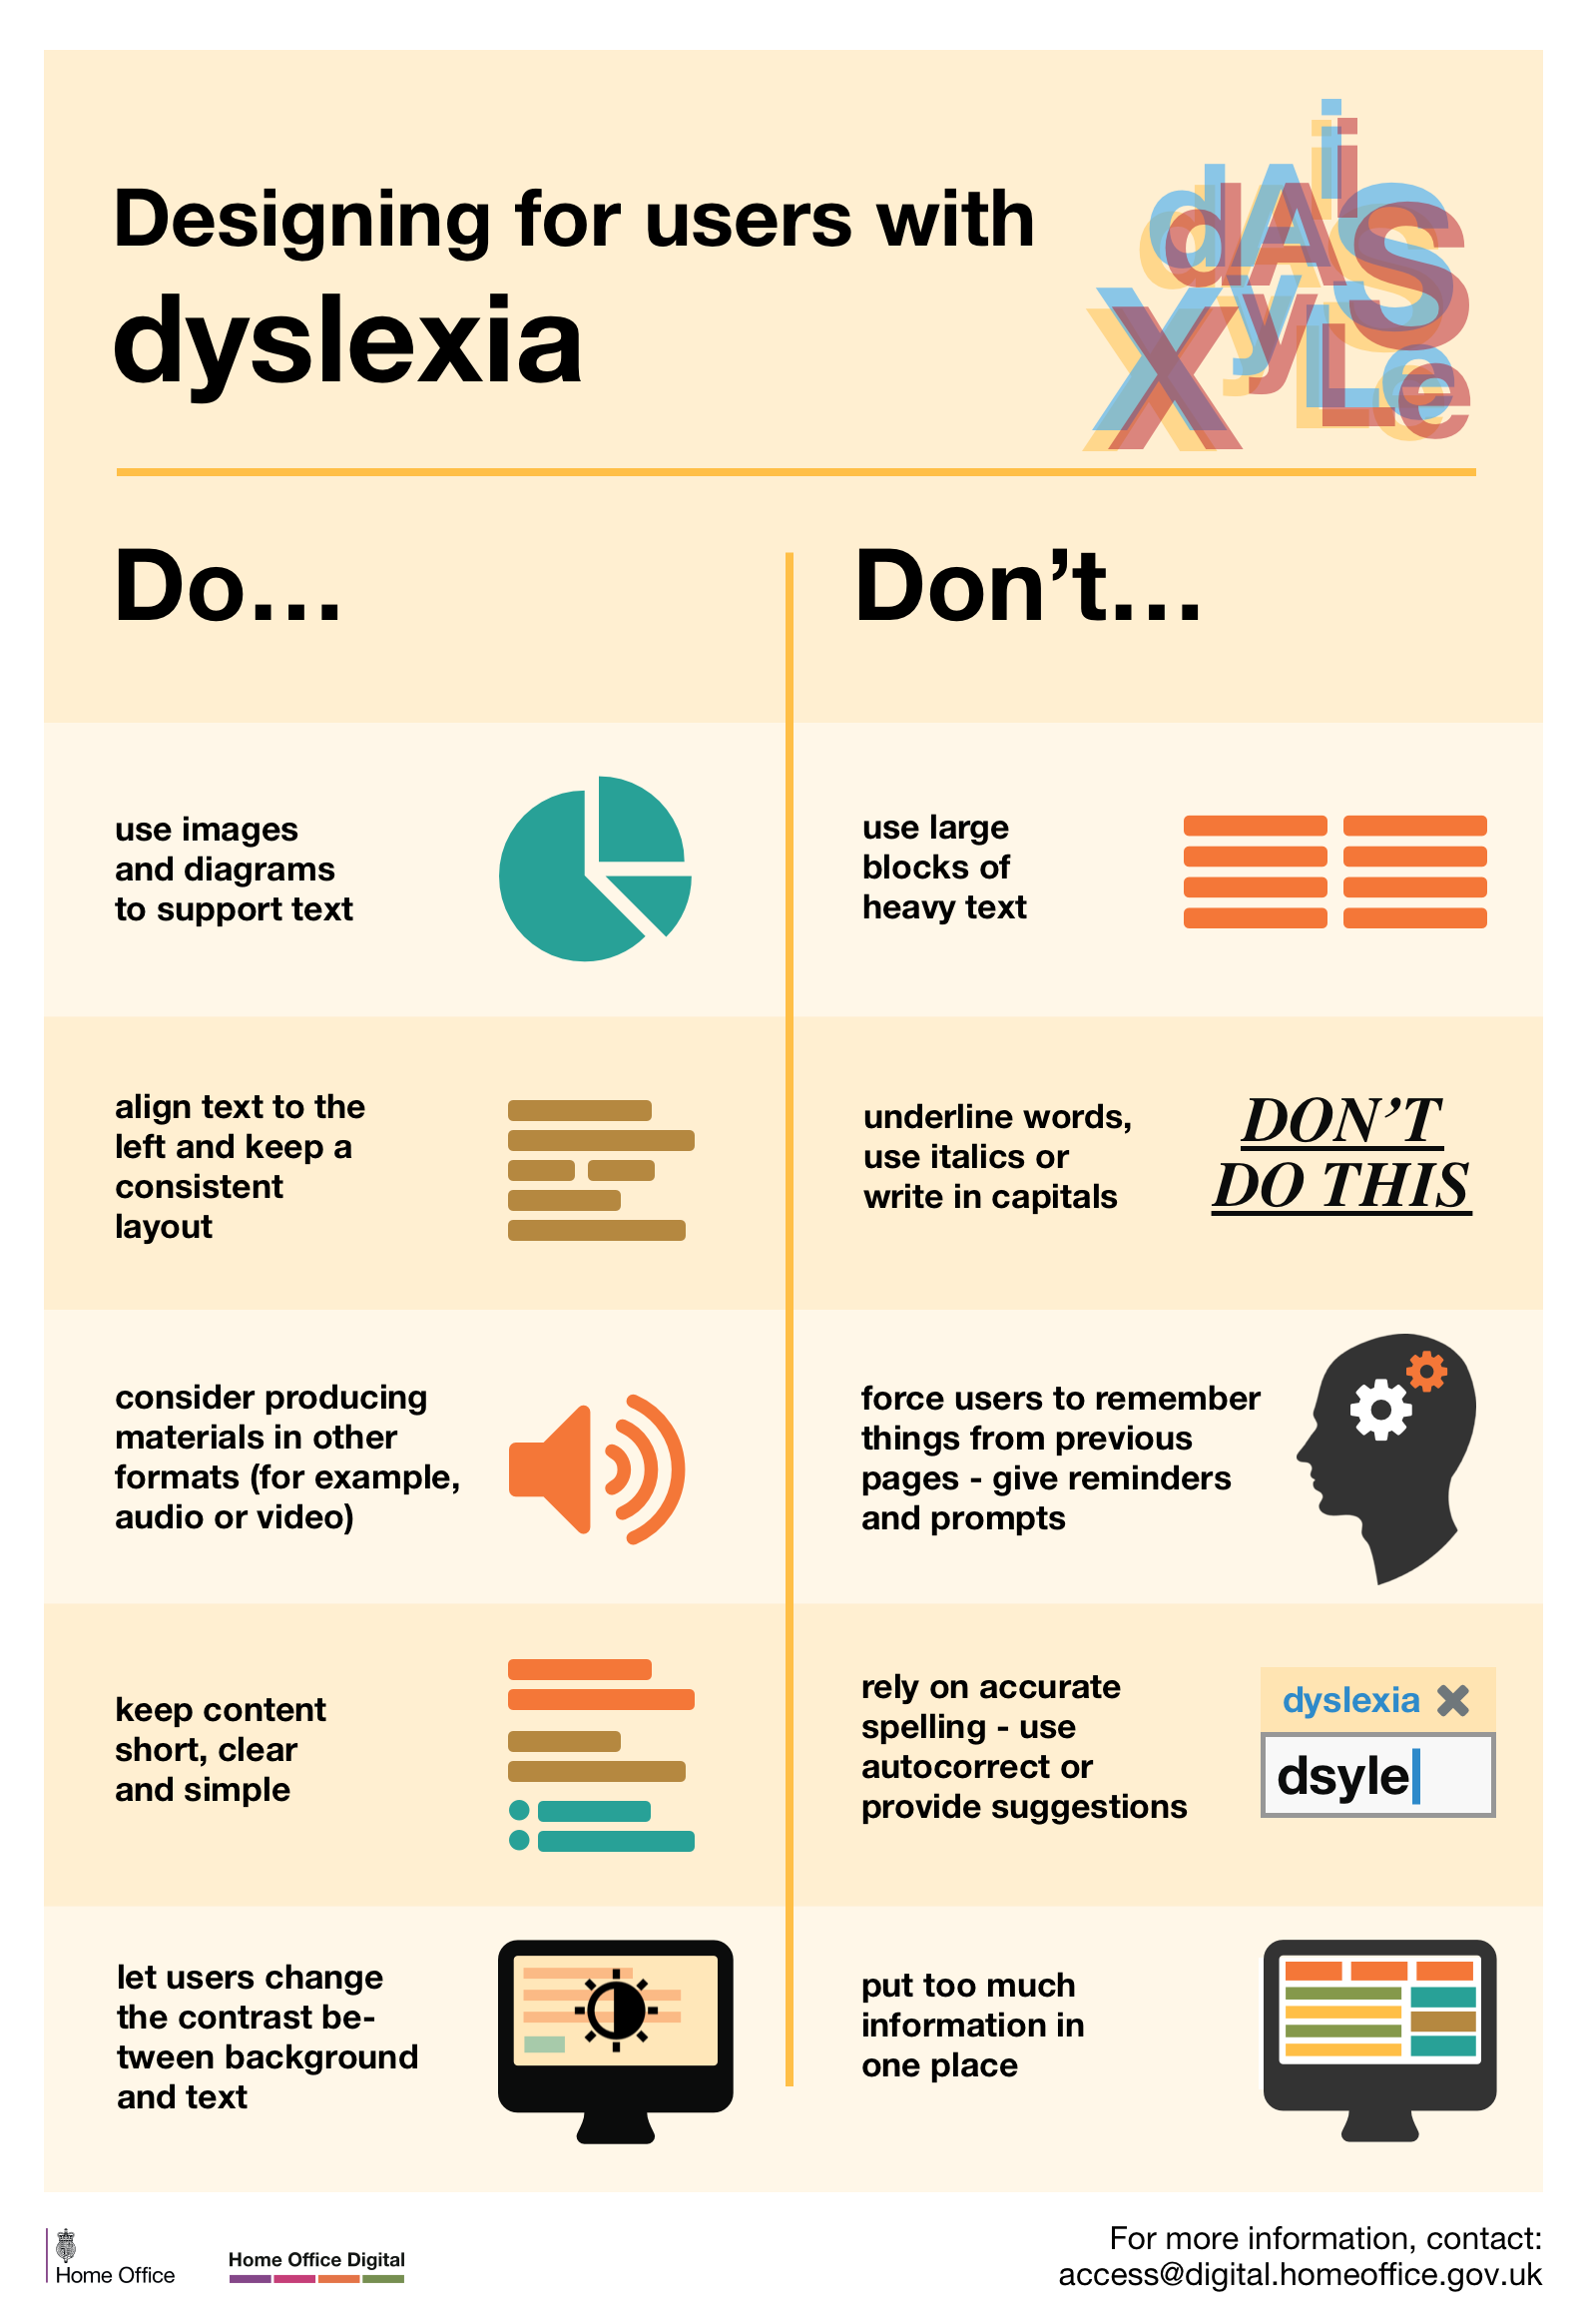
Read Full Article
Bol Replicates Airbnb's Experiment Which Confirms A Better Customer Rating Format
Bol has been noticed a/b testing at least 3 different versions of customer rating formats on their product detail pages.
Find out more about this leaked experiment on the back of this card.
A/B Test on Customer Rating Format
Social proof (sometimes referred to as “informational social influence”) refers to the tendency of human beings to follow the actions of others when making decisions, placing weight on these actions to assume “the correct decision.” Social proof can be used to deliver credibility to prospective users and promote adoption or acceptance in the design of products and services.
The rule of thumb is that highly rated and highly recommended products (and sellers) are more likely to be successful than those with poor or no ratings.
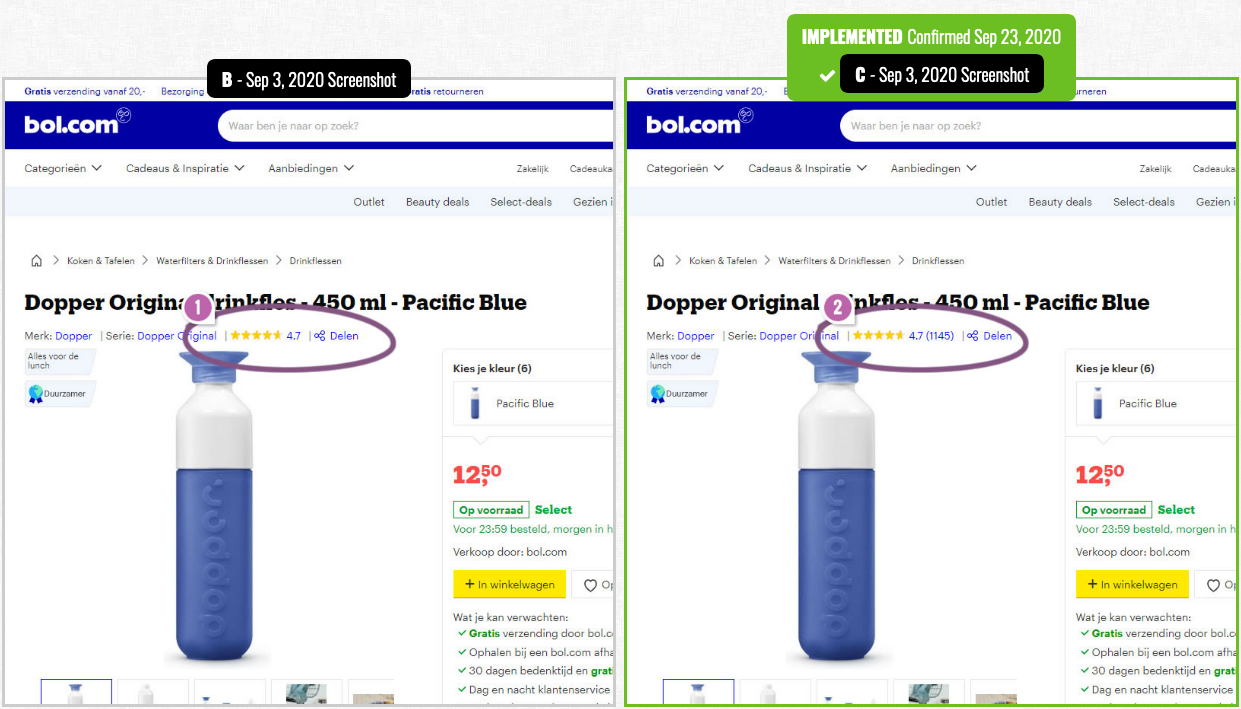
In this leaked A/B experiment, Bol tested 3 different customer rating formats for their product pages–one with star icons and the number of reviews, one with star icons and the average rating of the reviews, and one with star icons and both the average rating and total number of reviews.
Read the full article to find out which design was declared the "winner."
Read Full Article